String notebook
Created 12 Aug 2014 • Last modified 20 Aug 2014
Simple association
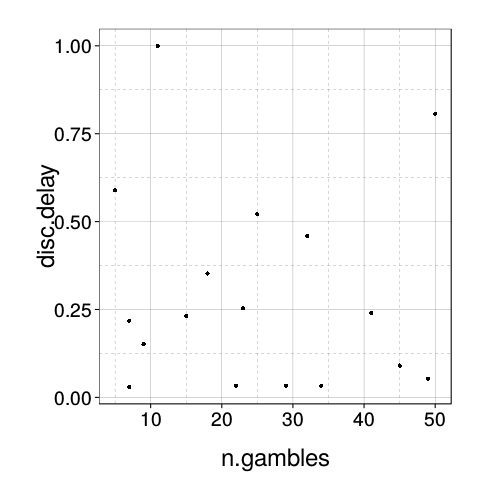
with(sb[good.s,], qplot(n.gambles, disc.delay))
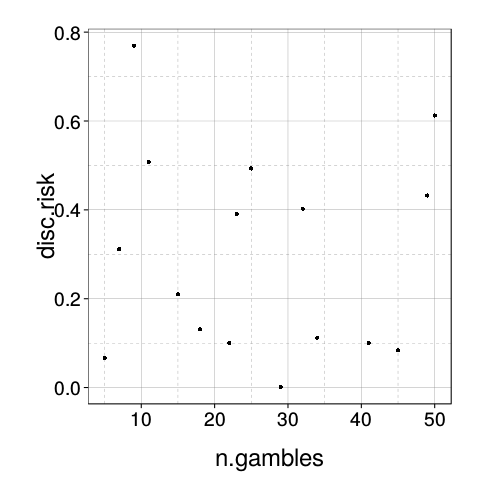
with(sb[good.s,], qplot(n.gambles, disc.risk))
rd(with(sb[good.s,], c(
    Delay = cor(n.gambles, disc.delay, method = "kendall"),
    Risk = cor(n.gambles, disc.risk, method = "kendall"))))
| value | |
|---|---|
| Delay | -0.015 |
| Risk | -0.015 |
So there is no real assocation between number of gambles taken and discount factor (for time or for risk). The correlation for delay at least has the right sign (less patient people took more gambles). For risk, on the other hand, we have the wrong sign (more risk-averse people took more gambles).